Common reporting about energy sector
The most common reporting on energy sector includes the following statistics:
- annual statistical energy balances
- monthly energy statistics
- energy prices
- energy efficiency indicators
- other energy indicators.
Energy balances
Annual energy statistics reported in the form of an energy balance is the most complete framework for the accounting of all energy products and their flows in the economy. It allows to policy makers and other energy statistics users to access current energy situation of the country, such as the total energy supply, including production of the primary energy at national territory, imports, exports, and stock change, then energy transformation processes, such as electricity and heat generation, refining of the crude oil to produce petroleum products and other transformations. Final energy consumption covers demand in manufacturing industry, transport sector, households, services, agriculture and fishing. Beside mentioned, energy balances include non-energy consumption, losses in energy networks, energy consumption in energy industries, energy delivered in maritime and aviation transportation bunkers and other. There are many purposes the energy balance is used: calculation of various indicators on energy security, energy efficiency, dependency, greenhouse gas emissions from fuel combustion, and input for modelling and forecasting and many other purposes.
Typical segments of the energy balance are illustrated in Figure 1.
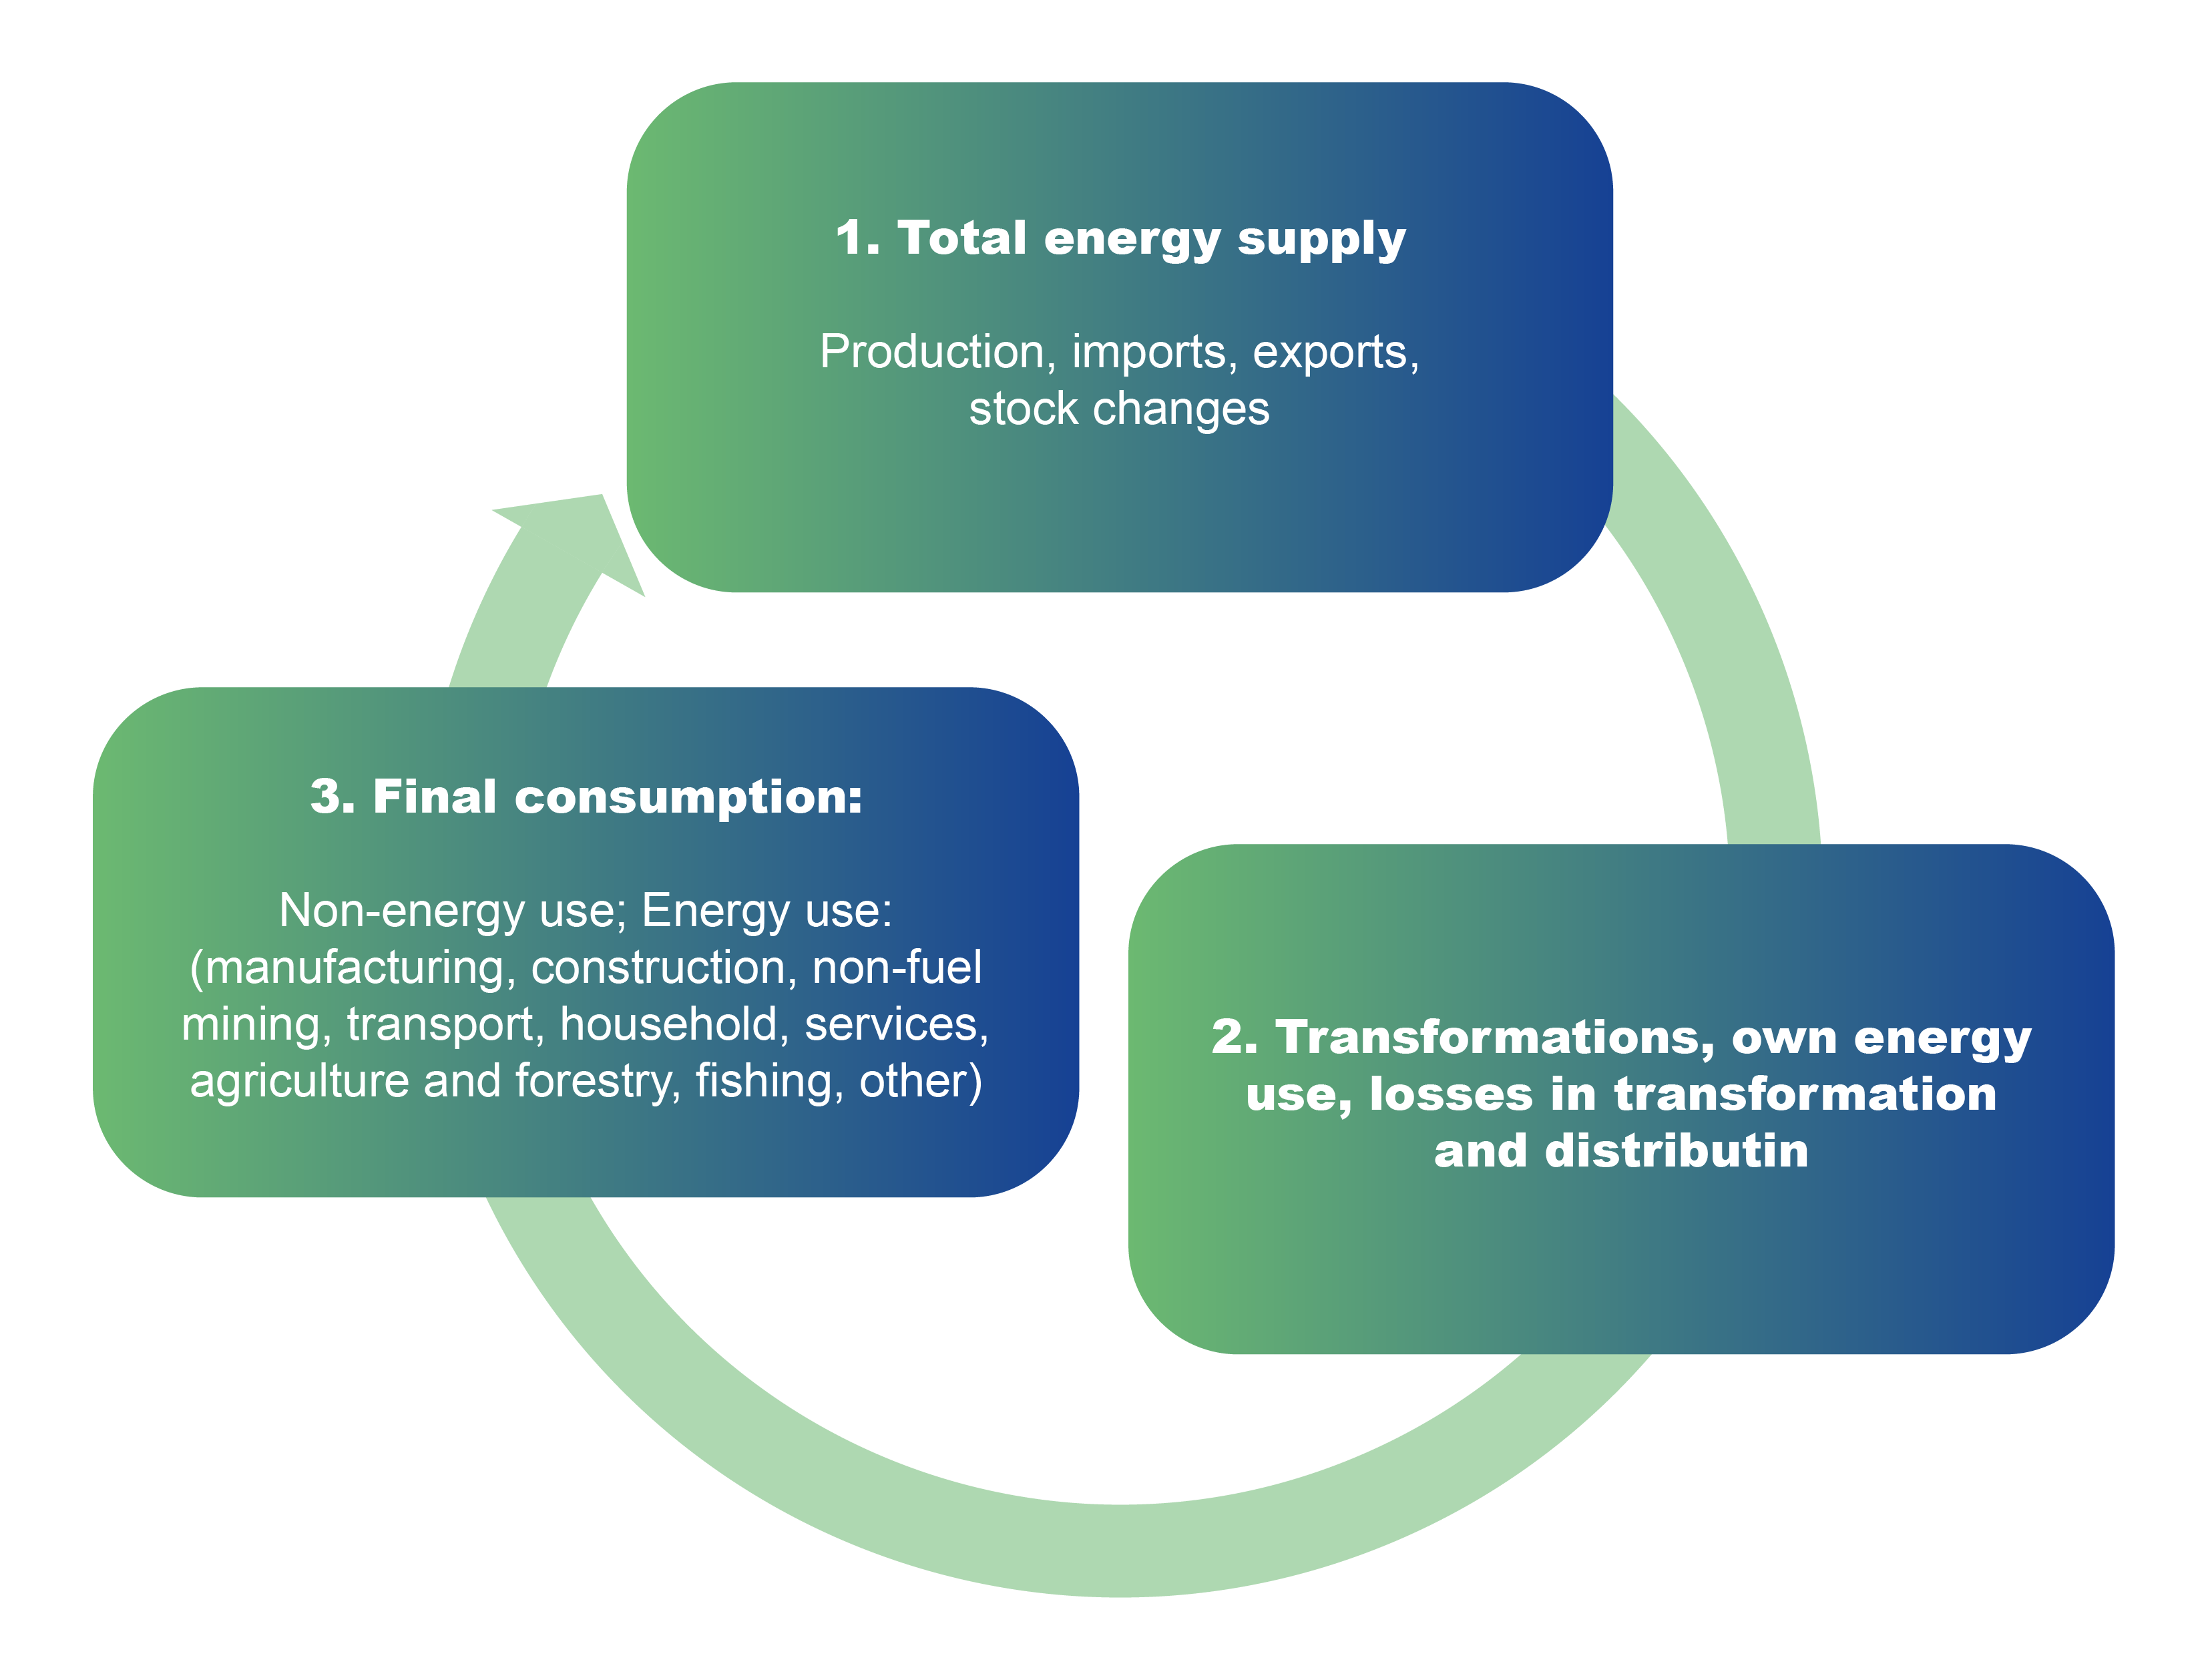 Figure 1: The key segments of the energy balance.
Monthly statistics
Monthly statistics provides less comprehensive statistical coverage then annual data but for shorter time periods giving much better insights into the trends and changes in energy supply in the country. Monthly statistics includes data on production, imports, exports, and stock changes on monthly basis with 2- or 3-months delay compared to real time. Monthly statistics includes only limited information about transmission and consumption and covers oil and petroleum products, natural gas, coal and electricity.
Energy prices
Energy prices statistics is mostly published for electricity and natural gas supplied to end-consumer: households and enterprises. To ensure full transparency of energy prices and real effects, price statistics should contain a detailed set of sub-components on taxes and levies and network prices. This leads to greater transparency and promotion of fair competition and market developments.
Energy indicators
The demand for monitoring and evaluation of energy efficiency policies in the country requires more and more indicators, such as energy efficiency indicators, whose importance has significantly grown over the last years. Energy efficiency indicators can be calculated starting from the aggregated to very disaggregated level. Specificity of this statistics is the need to split final energy of each sector, as shown in energy balance, on specific end-uses, which are the basis for calculating energy efficiency indicators. For example, in households and services sector there is a need to estimate quantities of energy that is used for space heating, space cooling, water heating, lighting and appliances. The main prerequisite for calculation of energy efficiency indicators are comprehensive surveys on energy consumption needs to be initiated and periodically conducted. Besides, it should be mentioned that not all the data necessary for calculation of the end-uses could be estimated based on the statistical data collection, but with additional, auxiliary modelling needs to be developed. These models need to be carefully designed because they have multi-purpose use: for calibrating the base year, estimation of the indicators in periods between surveys, monitoring the process and supporting the comprehensive modelling tools in energy planning and future energy sector scenarios analysis.
Process of the calculation of energy efficiency indicators in households and services is shown in Figure 2.
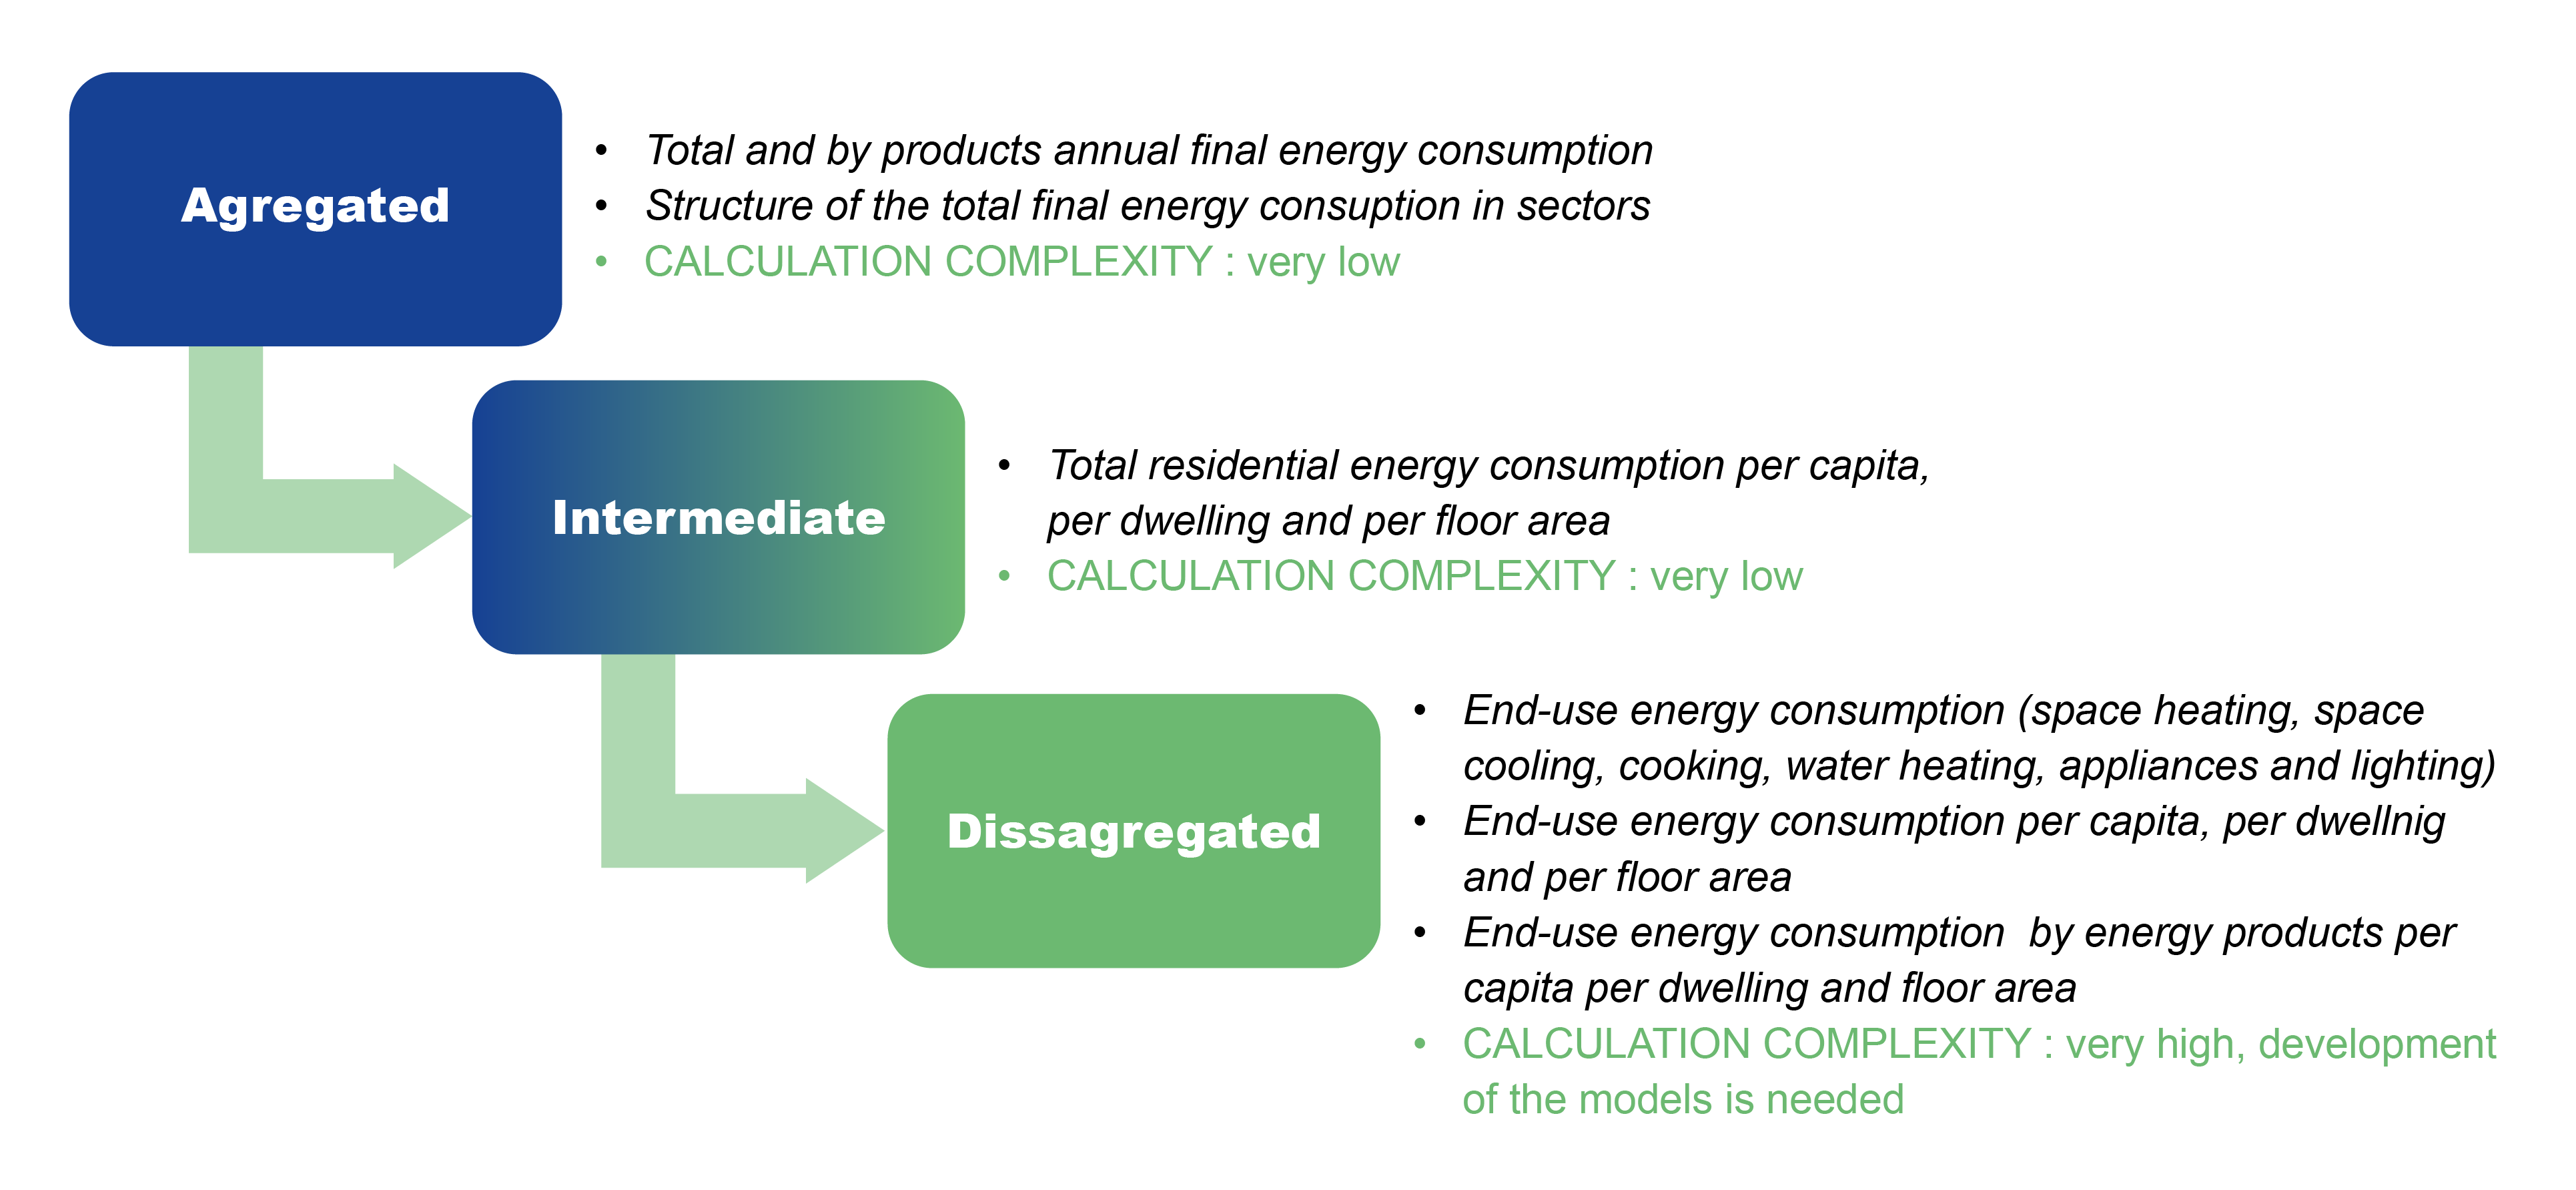
Figure 2: Process of the calculation of energy efficiency indicators in households and services.